
The Alternatives Series · Part 2 of 5
Following the Money
A wall of capital poured into private markets — and in 2026, a crowd headed for the exit
Alan F. Skrainka, CFA
Chief Investment Officer
If you want to understand where private-market returns are heading, start by watching where the money goes. The single most reliable pattern in the academic record is an uncomfortable one for anyone being pitched today: capital does not flow into private funds steadily. It surges in after a stretch of strong headline numbers — and those boom-era vintages tend to disappoint. More money chasing the same deals bids up the prices paid, and high entry prices are the enemy of future returns.
Steven Kaplan and Antoinette Schoar documented this two decades ago: new private-equity partnerships tend to launch right after the industry has done especially well, and buyout and venture returns fall as more money pours in. Later work reached the same conclusion — the best results often came from lean years when few were willing to commit. With that warning in mind, look at how much money has arrived.
A decade of inflows
Across private equity, private credit, and private real estate, assets under management have roughly doubled to tripled in a decade. Private equity alone now stands at about $8.6 trillion — dwarfing the other private segments, as the scale of today’s market shows.
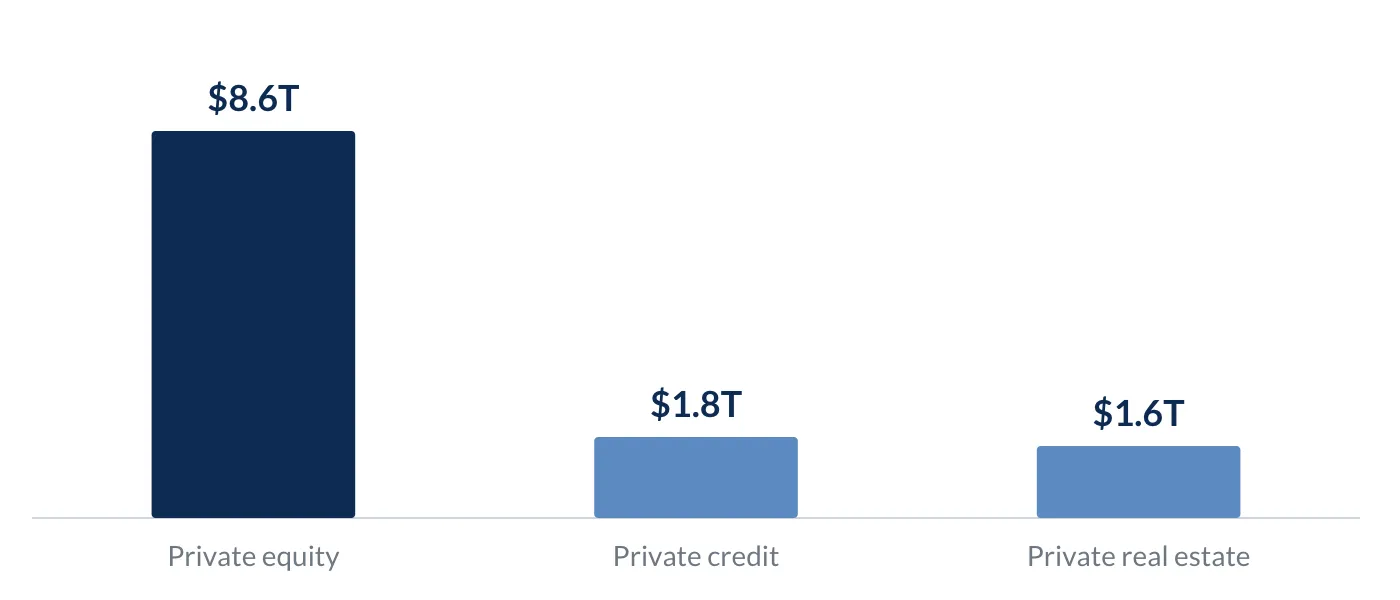 Private-markets assets under management by segment, 2024 ($ trillions). Source: Preqin (closed-end fund AUM; private equity excludes venture capital).
No corner has pulled in money faster than private credit — the very strategy now seeing the redemption lines. It has grown from roughly $0.3 trillion in 2010 to about $1.8 trillion in 2024, with Preqin projecting close to $2.8 trillion by 2028. Broader estimates that include uncalled commitments put the 2024 market near $3.5 trillion.
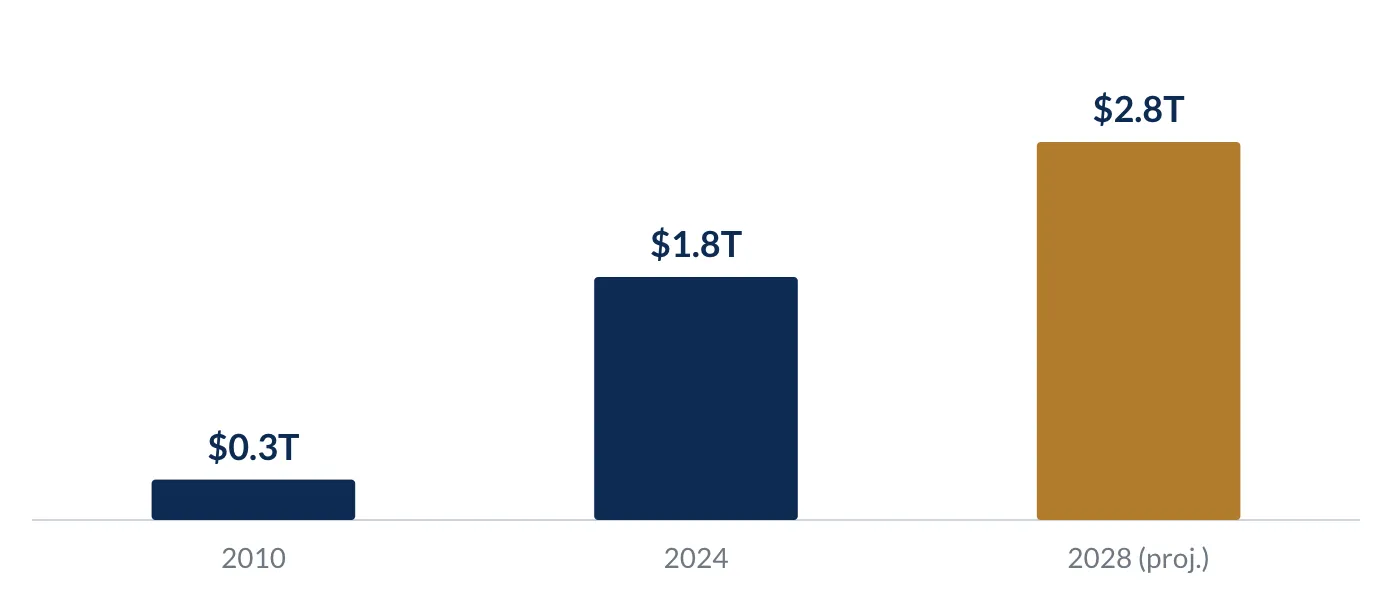
Private-credit fund AUM, 2010–2028F ($ trillions). Source: Preqin; AIMA. The 2028 figure is a projection; broader estimates including uncalled commitments put the 2024 market nearer $3.5 trillion.
The strong years pulled the money in, and that wave of money helped create the weaker ones that followed.
We are living through the modern version of that cycle. After the banner results of 2020 and 2021, capital flooded in, and managers now sit on a record pile of committed-but-uninvested cash — well over a trillion dollars. Deals are slow to sell, so cash is slow to come back, and new fundraising has cooled. Which brings us to what happens when the investors who rushed in decide they would like their money back.
The run for the exits
There is a moment when an investment quietly tells you what it really is. For semi-liquid private funds, that moment arrived in 2026. The vehicles at the center of it — non-traded business development companies (BDCs) and interval funds — are the most common ways ordinary investors now buy private credit. They hold illiquid loans but offer redemptions, typically once a quarter and usually capped at around 5 percent of assets. There is no exchange and no daily price; the manager estimates value, and you redeem at that manager-set mark. The quarterly cap, or “gate,” is not a flaw. It is a designed feature — and most investors do not absorb what it means until it binds.
In the final quarter of 2025, redemption requests at non-traded BDCs climbed to roughly 4.7 percent of assets, nearly three times the prior quarter. Early in 2026 the pressure intensified and the gates began to bind across the industry. The table tracks the key distinction throughout: requests — what investors asked to pull — versus what the cap actually let out.
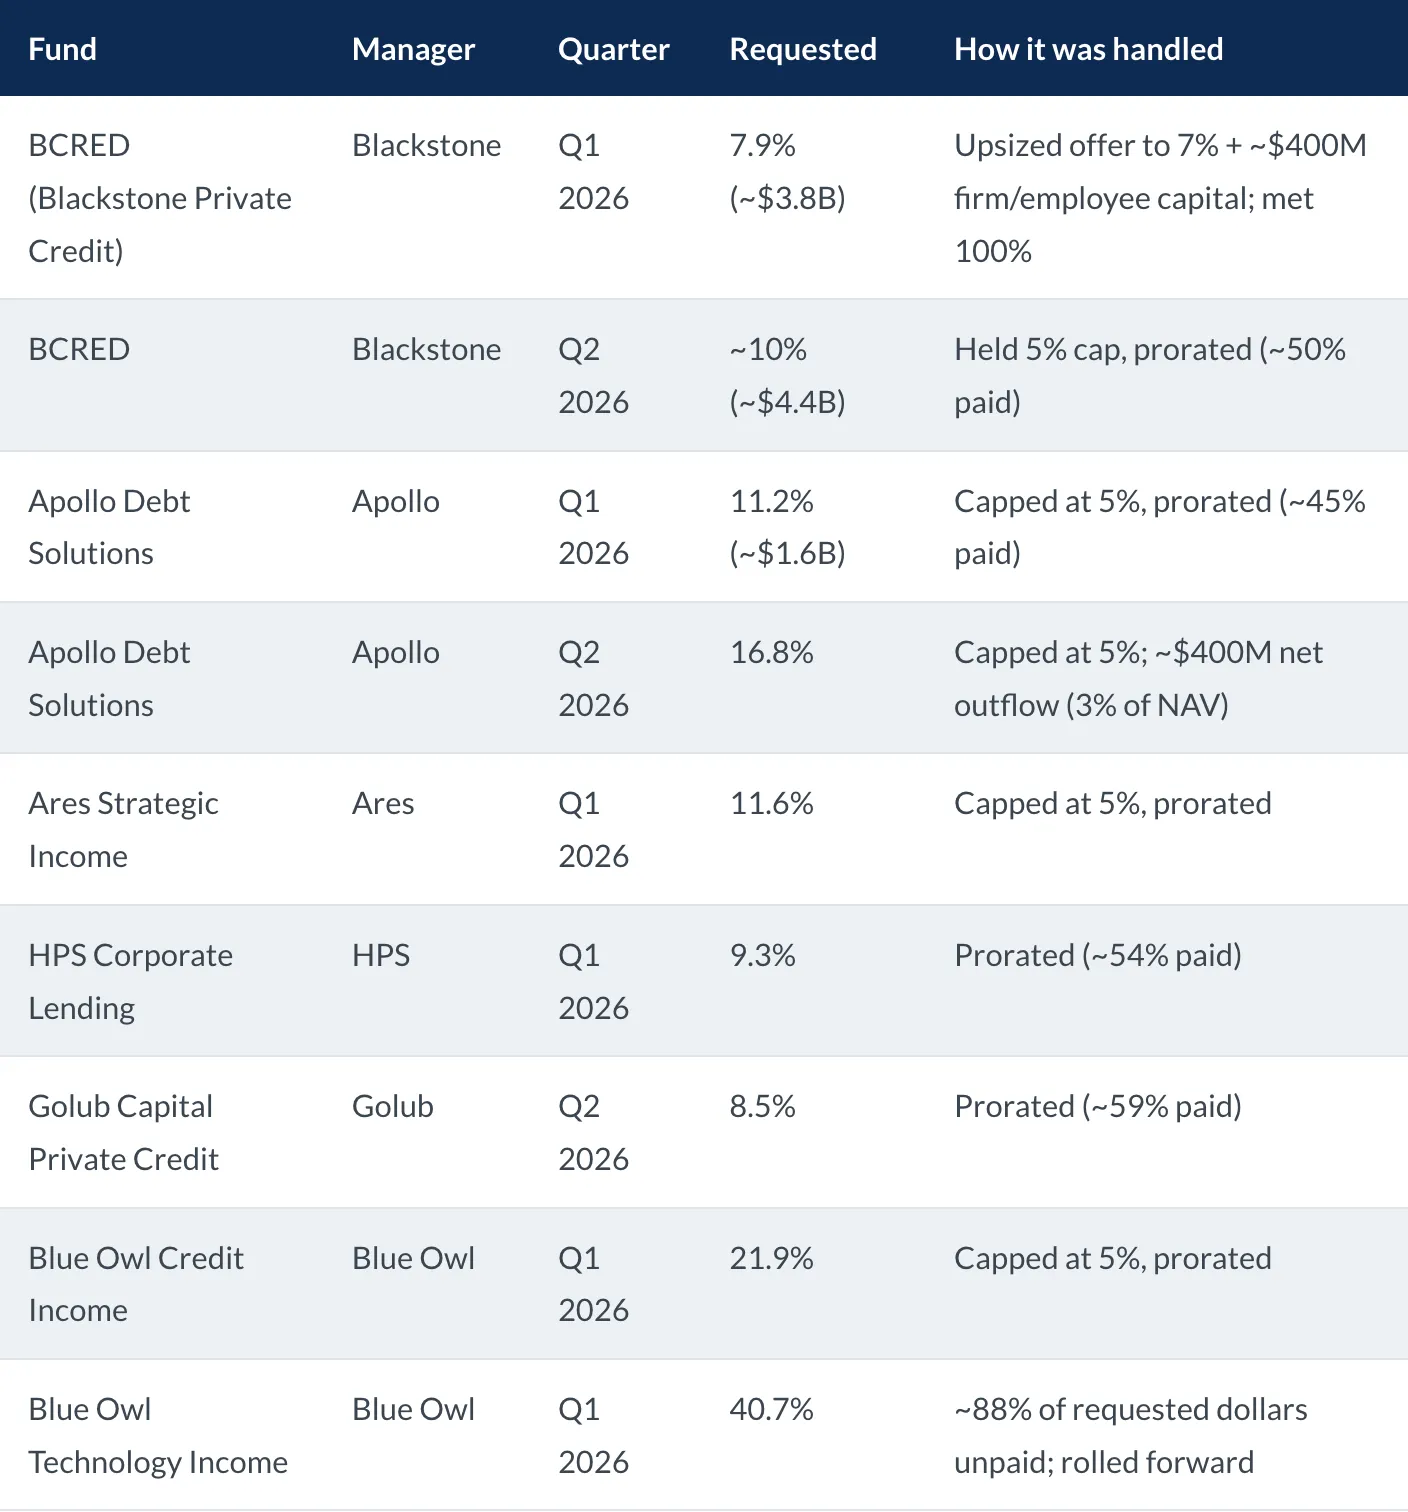
Sources: AltsWire; CNBC; PitchBook / Yahoo Finance; With Intelligence; Ferrante Capital Advisers; Wealth Management. Figures are as reported by the cited sources.
When the only way out of an investment is a small door the manager opens on certain days, you have learned something useful about what you actually bought.
Nearly every fund hit its cap and prorated — paying a fraction of what investors asked and rolling the rest forward. That is the gate working as designed. The differentiator was never whether a fund hit its cap; most did. It was what the sponsor did next. In the first quarter Blackstone raised its cap toward 8 percent and added hundreds of millions of its own and its employees’ capital to meet redemptions in full; most others simply let the 5 percent cap bind. The pressure is spreading, too — Switzerland’s Partners Group began curbing redemptions in a European private-equity vehicle in June, and the NAV REITs (BREIT, SREIT) were the same cautionary tale a cycle earlier. Sector-wide, non-traded BDC outflows exceeded inflows for the first time in Q1 2026, and Bank of America expects requests to stay above 5 percent through year-end.
The question this raises
So the money rushed in after the good years, the academic record warns that such waves precede weaker returns, and the promised liquidity turned out to be conditional the moment a crowd wanted out. Which leaves the question the rest of this series takes up directly: once you strip away the smoothed pricing, the borrowed returns, and the marketing, have private funds actually delivered the returns and the safety that justify the lockups and the fees? Part 3 shows how the numbers get dressed up. Part 4 asks whether the best managers can even be identified in advance. And Part 5 delivers the verdict.
Important Disclosures
This material is provided for educational purposes only and reflects general guidance, not personalized investment advice. Alan Skrainka, LLC is not a registered investment adviser, and nothing herein should be construed as a recommendation to buy, sell, or hold any security or to pursue any particular investment strategy. Alternative investments involve significant risks, including illiquidity and the potential loss of capital, and are not suitable for all investors. Past performance is not indicative of future results. Readers should consult a qualified financial professional regarding their individual circumstances before making any investment decision.
The Alternatives Series · Read in order
- Do the Best Managers Stay the Best?
- Are Private Markets Worth It?